 G-Cubed
Model-run examples
Start with these common report views: GDP and inflation paths, a regional comparison in one year, and sector-output panels. They use actual saved G-Cubed 2A build 200 baseline output, with two regions and two sectors. The observations are a direct subset of the saved CSV, without rebasing, rounding or other economic transformations.
The source run completed on 25 September 2026 at 05:33 UTC, with a 2023 base year. These selected 2025–2035 projections illustrate chart presentation; they are not an accepted forecast. A successful saved run does not establish validation against every subsequent model-source change. See the source and extraction record.
Download the complete chartpack and matching projections CSV. The declarations use chartpack "1.4.0"; check package and template compatibility before using them in a report. The images below are static previews; controls such as the GDP bar chart’s Year selector operate in a generated report.
Follow GDP through time
Lines show the path and relative scale of real GDP in the United States and rest of the world. GDPR is a level, not a GDP growth rate or a percentage deviation from baseline. The axis uses the source CSV’s $US billion units.
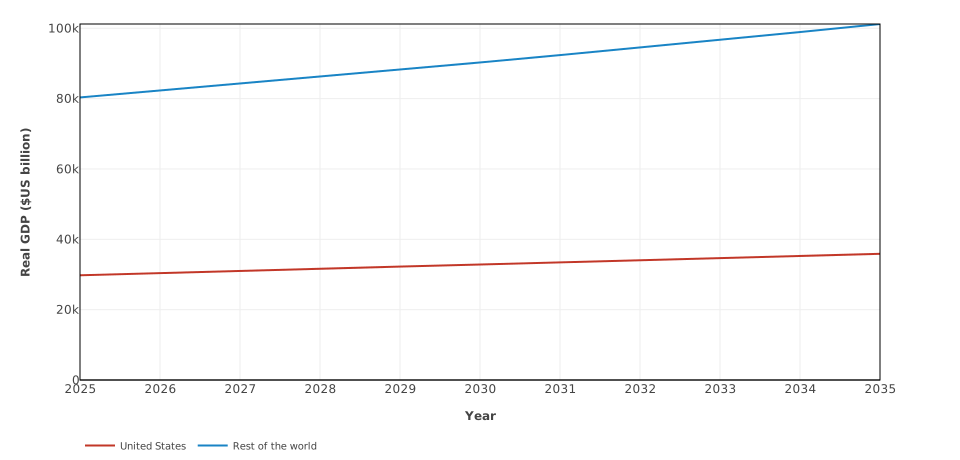
Saved 2A build 200 baseline levels for the United States and rest of the world; charting illustration only.
- chart:
    title: Real GDP baseline paths
    x_axis: { label: Year }
    y_axis: { label: "Real GDP ($US billion)", min: 0 }
    series:
      - variable: GDPR(USA)
        label: United States
      - variable: GDPR(ROW)
        label: Rest of the world
Follow inflation through time
Keep inflation on its own axis because its units differ from GDP. INFL already contains consumer price inflation rates, expressed in percent. Subtracting two inflation rates would produce a percentage-point change; this chart plots the rates themselves.
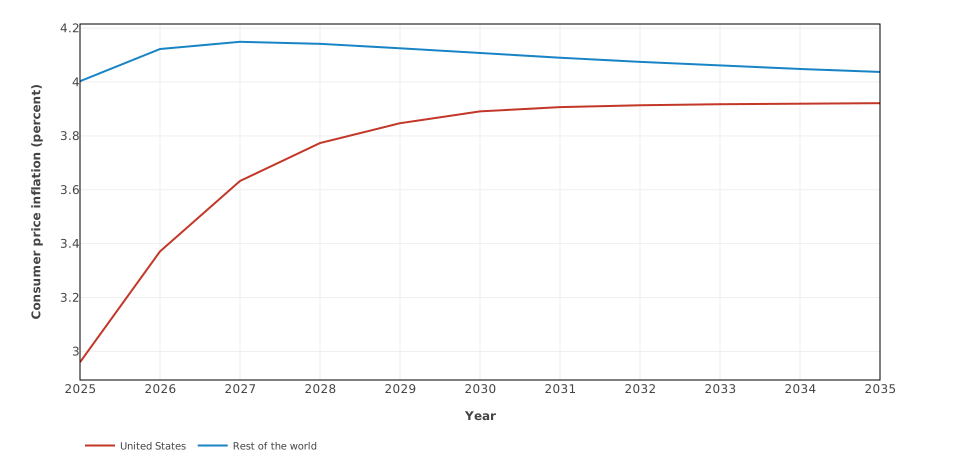
Annual consumer price inflation rates from the same saved baseline; these are levels, not changes from baseline.
- chart:
    title: Consumer price inflation baseline paths
    x_axis: { label: Year }
    y_axis: { label: "Consumer price inflation (percent)" }
    series:
      - variable: INFL(USA)
        label: United States
      - variable: INFL(ROW)
        label: Rest of the world
Compare regions in one year
Horizontal bars make a selected-year regional comparison easy to read. series-value plots each region’s 2030 GDP level. With year_selector: true, the report offers every eligible year in the declared 2025–2035 range and updates the title, table and exports together.
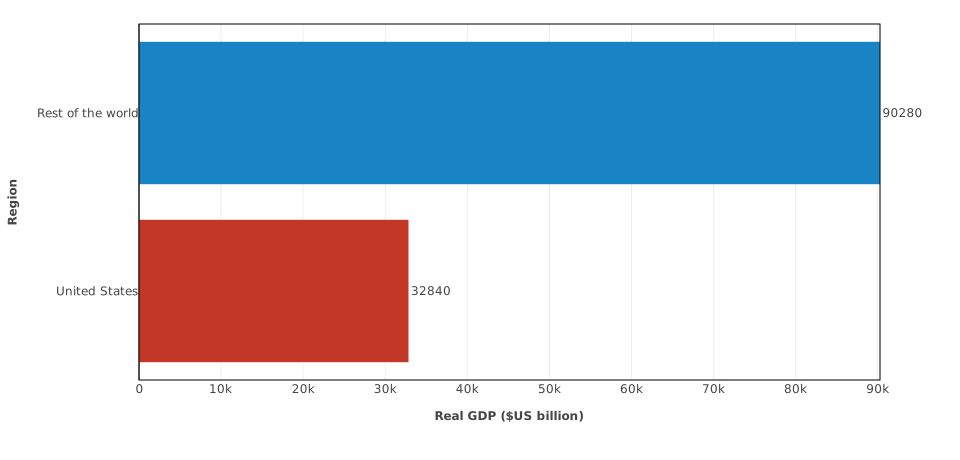
A single-year comparison of baseline GDP levels; the generated report can select any year from 2025 to 2035.
- chart:
    title: Real GDP by region in 2030
    chart_type: series-value
    orientation: horizontal
    year: 2030
    year_selector: true
    show_labels: true
    sort: value-descending
    x_axis: { label: "Real GDP ($US billion)", min: 0 }
    y_axis: { label: Region }
    series:
      - variable: GDPR(USA)
        label: United States
      - variable: GDPR(ROW)
        label: Rest of the world
Compare sector paths within regions
Small multiples give each region a panel and each sector a line. Shared axes retain comparisons of absolute magnitude across panels. OUP measures gross domestic production by sector: energy (a01) and non-energy (a02) here. Gross output includes intermediate production, so adding these sector levels does not produce GDP.
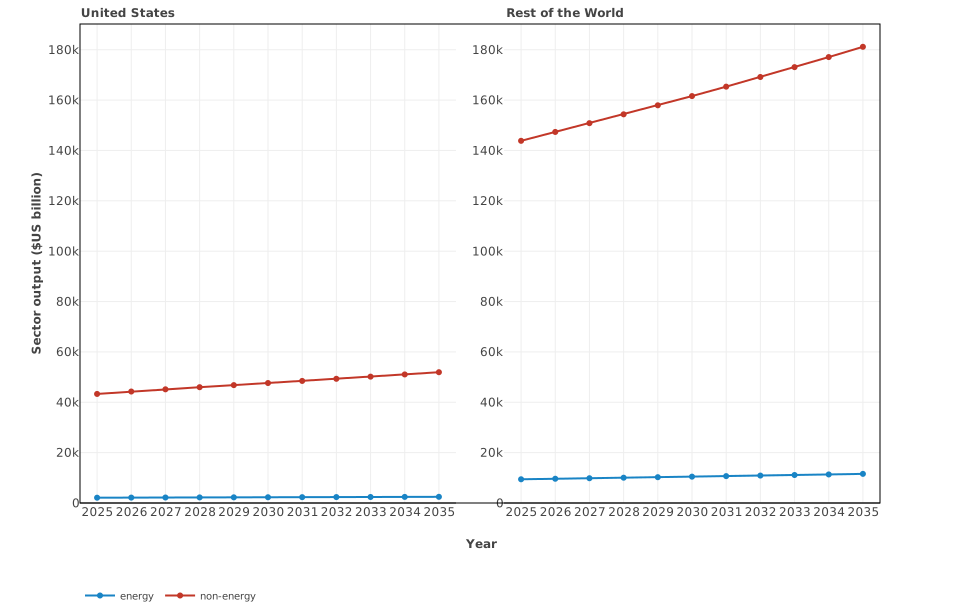
Energy and non-energy gross output in each region, using shared axes; gross output is not GDP.
- chart:
    title: Sector output baseline paths by region
    chart_type: small-multiples
    facet_dimension: regions
    group_dimension: sectors
    x_axis: { label: Year }
    y_axis: { label: "Sector output ($US billion)", min: 0 }
    series:
      - variable_prefix: OUP
        selectors: { sectors: all, regions: all }
Each snippet is a chart entry. The complete download adds captions and the shared header with start_year: 2025 and end_year: 2035.
Show experiment deviations
For an experiment, prefer regional bars or a heatmap centred on zero when comparing positive and negative effects. Supply a deviation projections CSV generated by the reporting pipeline, and use its units: GDP and output deviations may be percentages, while inflation deviations are percentage points. The baseline CSV on this page contains levels and cannot stand in for those deviations. Follow the regional snapshot and deviation heatmap setup recipes. The chart-type guide covers the remaining presentation options with explicitly synthetic data.